Fundamental vs Technical Analysis: Clear Methods to Understand and Compare Stock Market Techniques

Choosing how to evaluate stocks shapes outcomes. Fundamental analysis assesses intrinsic value through financial health and economic indicators; technical analysis examines price trends and market data via charts. Each has distinct strengths, and understanding their differences helps you pick an approach that matches your goals. This article outlines both methods, their benefits, practical uses, and how they compare.
Comparison of Fundamental vs. Technical Analysis in Stock Market Techniques
Fundamental and technical analysis are the main approaches to judging stocks. They rely on different data sets and support different investment philosophies.
Fundamental Analysis
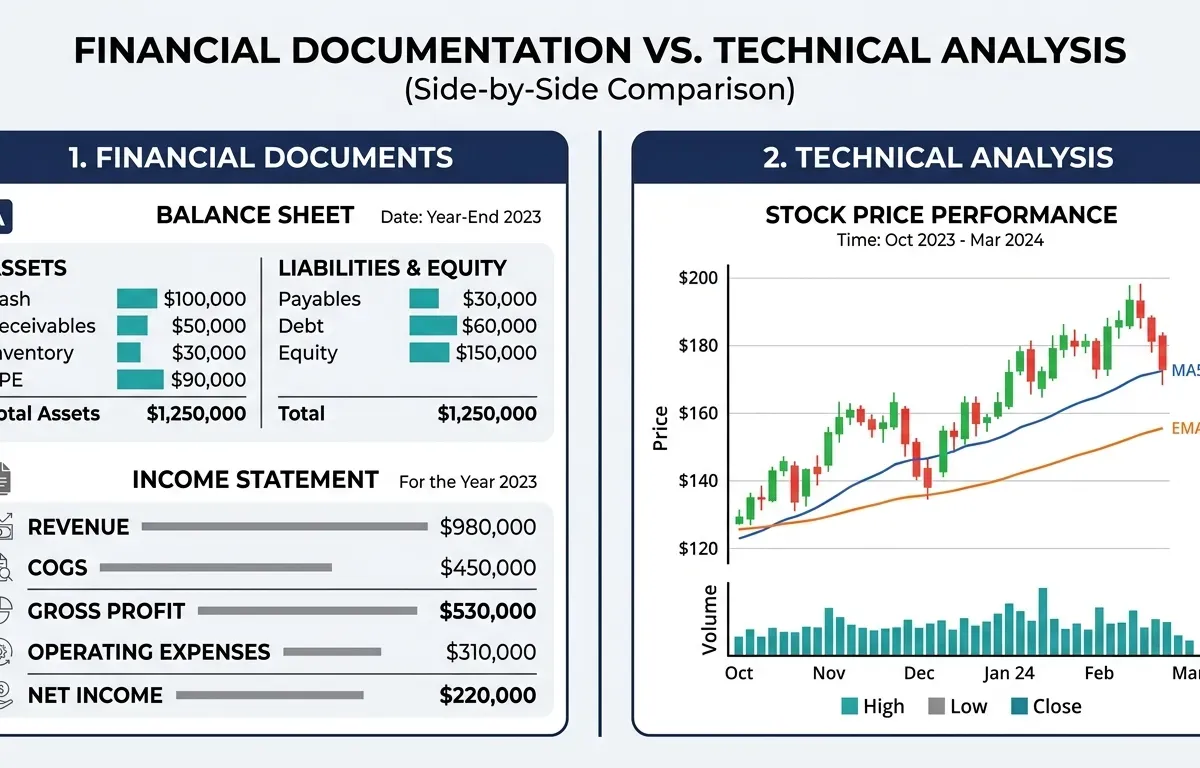
Fundamental analysis evaluates a company's financial health and growth prospects using statements like the income statement, balance sheet, and cash flow statement to estimate intrinsic value. Analysts use ratios such as the price-to-earnings (P/E) ratio and return on equity (ROE) to compare performance with industry benchmarks and support long-term decisions.
Technical Analysis
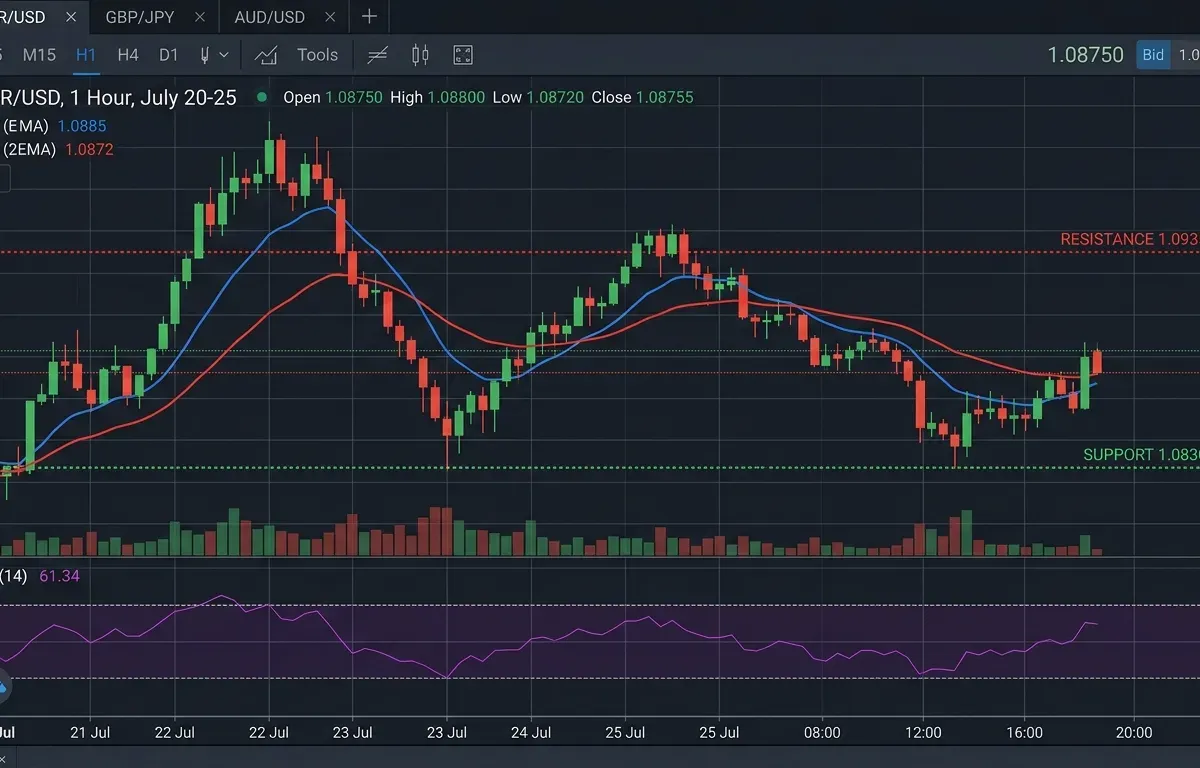
Technical analysis focuses on price movement and volume. Traders use charts and indicators — moving averages, the relative strength index (RSI), and candlestick patterns — to identify short-term trends and time entries and exits. Forex indicators such as the MACD and Bollinger Bands are also widely used to read momentum and volatility in currency markets.
Taken together, these approaches provide complementary perspectives on market dynamics and valuation.
Advantages
Knowing each method's strengths helps investors choose the right approach for their objectives and outlook.
Fundamental Analysis
- Long-term Growth Potential: Identifies undervalued companies with solid fundamentals for potential long-term gains.
- Risk Mitigation: Financial health analysis supports decisions that can reduce exposure to volatility.
- Comprehensive Insight: Incorporates economic indicators, news, and qualitative factors for a broad view.
Technical Analysis
- Quick Decision-Making: Lets traders react to market moves for short-term opportunities.
- Adaptability: Emphasizes trend identification and price action to respond to changing conditions.
- Versatile Tool Kit: Many indicators and charting techniques let traders tailor strategies, including scalping trading strategies for traders targeting very short-term price movements.
Practical Applications in Investment Strategies
Investors often combine both methods to build balanced strategies suited to changing markets.
Fundamental Analysis
Central to long-term portfolio planning, it identifies growth candidates and supports diversification and strategic capital allocation based on vetted financial data.
Technical Analysis
Used for short-term strategies, chart analysis highlights entry and exit points. Many traders use a price action strategy — reading raw price movement without relying on lagging indicators — to make faster, cleaner decisions. Fundamental context is often added to strengthen signals.
What Is Fundamental Analysis and How Does It Evaluate Financial Health?
Fundamental analysis examines measurable metrics to reveal intrinsic value, using financial statements and ratios to assess performance and growth potential.
Which Financial Statements and Ratios Are Essential in Fundamental Analysis?
Key statements include the income statement, balance sheet, and cash flow statement. Investors use ratios — P/E, current ratio, and debt-to-equity — to assess profitability, liquidity, and solvency. The combination of these tools gives a thorough picture of whether a company is worth its current market price, which is why fundamental analysis vs technical analysis comparisons often come down to time horizon: fundamentals reward patience.
How Does Sustainability Data Enhance Traditional Fundamental Analysis?
Adding sustainability metrics — such as environmental impact and corporate social responsibility initiatives — broadens assessment of long-term viability and ethical practices alongside financial results.
What Is Technical Analysis and How Does It Interpret Price Trends?
Technical analysis interprets price action and market patterns to identify likely short-term movements, converting chart patterns and statistical indicators into trading signals.
Key Indicators Used
Traders commonly use moving averages, Bollinger Bands, and Fibonacci retracements to assess trend, momentum, and potential reversal points. Forex day trading in particular relies heavily on these tools to manage rapid intraday moves across currency pairs.
How Can Price Movement Analysis Assist Short-Term Investment Decisions?
By studying historical patterns, traders spot trends and reversals to time trades, aiming to improve returns while managing risk. Scalping forex markets, for example, requires reading price action in real time — often using 1-minute or 5-minute charts alongside forex indicators to identify micro-opportunities.
How Do Fundamental and Technical Analysis Compare for Different Investment Strategies?
Understanding their differences helps investors align methods with goals and time horizons.
What Are the Advantages and Limitations of Each Analysis Method?
Fundamental analysis gives deep insight into intrinsic value but can miss short-term moves. Technical analysis improves trade timing but may overlook company fundamentals if used alone.
The main divergence is in time horizon and the types of data each prioritises. Technical investing vs fundamental approaches are not mutually exclusive — many experienced investors use both, letting fundamentals determine what to buy and technicals determine when.
Can Combining Both Approaches Improve Stock Market Decision-Making?
Yes. Using fundamentals to identify sound companies and technicals to time entries and exits creates a more resilient strategy. For traders asking what the best forex strategy is, the answer often involves layering both: screening currency pairs using macro fundamentals, then using technical setups to execute.
How Can Investors Use Analysis Techniques to Incorporate Sustainability into Investment Choices?
More investors factor sustainable practices into decisions. Including sustainability metrics in both methods helps align investments with values while improving decision quality.
What Are the Benefits of Integrating Environmental and Social Metrics with Financial Analysis?
Combining environmental and social metrics with financial analysis offers a fuller picture of long-term sustainability. Companies that prioritise sustainable practices may show greater resilience to market swings, appealing to some long-term strategies.
How Do Financial Platforms Support Sustainable Investment Decisions Using These Techniques?
Platforms provide tools that merge sustainability and financial data for both fundamental and technical evaluation, enabling data-driven choices aligned with investor goals.
Wire Clarity, as a Conectiv representative group, connects members to financial education resources, live trading sessions, and market analysis tools that help develop both fundamental and technical literacy. Whether you are building a long-term portfolio or learning to read charts, Conectiv's platform gives you the framework to make more informed decisions.
Frequently Asked Questions
How should investors decide between fundamental and technical analysis?
Decide by goals, risk tolerance, and time horizon: long-term investors often favour fundamental analysis; active traders use technicals. Many combine both for balance.
Can beginners effectively use both fundamental and technical analysis?
Yes. Start with fundamentals to learn valuation, then add core technical indicators and chart patterns. Practice via courses or demo platforms.
What role do market conditions play in choosing an analysis method?
In volatile markets, technicals can offer quick timing signals; in stable markets, fundamentals support deeper company evaluation.
Are there common pitfalls to avoid when using these analyses?
Avoid relying solely on one method. Technicals can miss news; fundamentals can miss short-term opportunities. Combining both reduces those risks.
What tools or software can assist in performing these analyses?
For fundamentals, use Bloomberg, Yahoo Finance, or financial databases for statements and ratios. For technicals, charting platforms such as TradingView and MetaTrader offer indicators and historical data.
How can understanding both analyses lead to better investment returns?
Combining intrinsic-value assessment with favourable market trends can reveal better entry and exit points, improving return potential while managing risk.
Building Your Investment Analysis Foundation
Whether you lean toward fundamental analysis, technical analysis, or a combination of both, developing a clear framework is what separates reactive trading from intentional investing. Understanding how to read a balance sheet and how to spot a trend on a chart are skills that compound over time.
Conectiv's financial education platform — available through Wire Clarity — offers courses, live market sessions, and trading tools designed to build exactly that kind of literacy. If you are ready to strengthen your approach to the markets, we are here to help.
(770) 628-5463
Or visit the Wire Clarity contact page to learn more about Conectiv membership options and financial education programs.